In 2024, with elections spanning 64 countries and driving significant advertising spending, the opportunities for impactful storytelling are vast. However, challenges such as sourcing high-quality data and time pressure persist.
Knowing this, Mapbox offers a comprehensive election mapping solution for global customers. Our experts Cris Byers, BI & Data Product Lead, and Arun Ganesh, Cartographer & Software Engineer, hosted a webinar titled “How Mapbox Interactive Boundaries and Mapping Solutions Empower Election Storytelling” to address these challenges for seasoned media outlets, campaign management agencies, or aspiring builders.
Watch the recording here to explore our in-depth global boundaries, technical voting map solutions, customer use cases, and tutorials for creating modern election maps at any scale.
Identifying challenges in election mapping and storytelling
At the beginning of the webinar, Cris sent a poll to attendees asking, “Which of the following are the most challenging aspects of election mapping and storytelling?” The top answers from attendees were 1.) Finding high-quality data including boundaries and geospatial data and 2.) identifying interesting stories within the data to engage viewers
With that in mind, the hosts dove into utilizing Mapbox for no/low code election solutions to address the top two challenges head-on, enabling you to find compelling stories within the data and create engaging visualizations.
The team also noted that while building the map itself presents difficulties, the real challenge lies in weaving data and visuals into a compelling narrative:
- High-quality data: It's hard to find reliable and accurate data sources, including geospatial data and boundaries data
- Time pressure: Especially during live election coverage, media outlets need to create and update maps quickly while maintaining accuracy. Campaign teams need to adapt their storytelling based on real-time results.
- Finding the story: You need to identify trends, surprising results, or human interest angles within the data to engage viewers.
- Data visualization: Just showing raw numbers on a map can be dry. Effectively representing complex data within your branding in an engaging way is key.
How Mapbox solutions solve the challenges
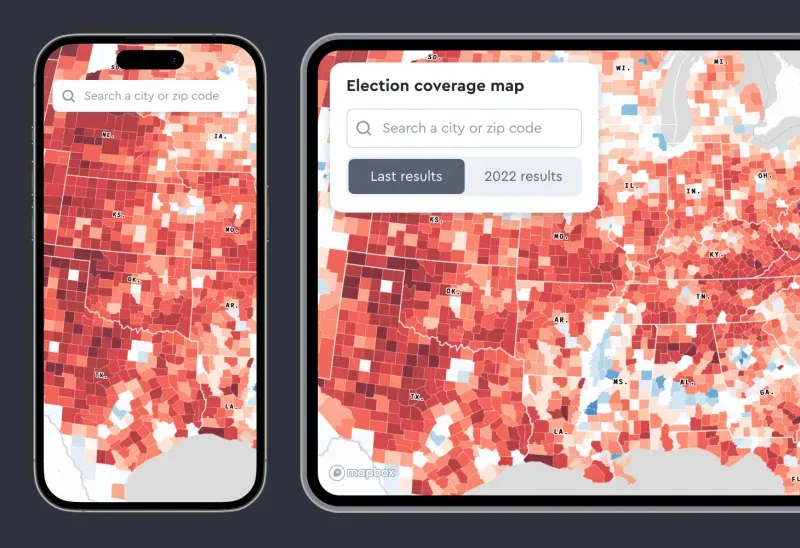
With the many challenges in mind, Cris shared how our solutions can work for anyone. Starting strong with high-quality and out-of-the-box boundaries data, providing access to the most up-to-date and global boundaries data available. Our mapping platform is scalable and highly customizable, allowing users to visualize large amounts of data with optimal performance. We aim to empower users to create dynamic maps that captivate customers and encourage active engagement. This is achieved through various means, including building data-driven interactive visualizations layered on Mapbox base maps, which offer a 3D Globe View and extensive customization options.

Our platform also supports map creation for web, mobile apps, and responsive mobile web, ensuring a consistent cross-platform experience. Additionally, users can quickly create lightweight, static maps usable across all platforms. With ready-to-use templates, users benefit from real-time operational agility, enabling quick updates to maps and data using low-code tools, facilitating adaptation of messaging based on results. Our movement data provides valuable insights into geospatial analysis.
Election use cases from The New York Times and ProPublica
Leading organizations like The New York Times and ProPublica have utilized Mapbox for election mapping, showcasing election results, and visualizing survey data to engage audiences effectively. Cris shares exactly how these companies were able to do it.


Live demo of Mapbox for elections

In a captivating live demonstration, Arun Ganesh guided the group through the process of creating interactive election maps using Mapbox's intuitive tools. From importing data to customizing map styles, you'll learn how to craft compelling visualizations that captivate your audience. View the free demo code here.
Ready to bring Mapbox to your team? Visit this page or create an account to get started.